You Ran an Election – Now What? Using Data to Engage Members

Click image to view full size.
Last Updated on August 20, 2025 by Hannah Seeley
Table of Contents
- Why Do I Need Election Analytics?
- Real-World Examples
- How Member Data Can Shape Your Next Election
- Mistakes To Avoid When Looking At Election Data
- Make Your Next Election Even Better
Although your election is over, your work isn’t done just yet. Now it’s time to review your election performance data. Every election generates valuable insights about your members: how they engage, what motivates them to vote, where they get stuck, and what they need to feel heard.
Running an election is no small feat. Fortunately, switching to a digital voting platform handles a lot of the heavy lifting for you, managing everything from voter lists to reminders and tabulation. If you’re using an election platform like SBSHub, you already have access to this data – you just need to use it.
In this guide, you’ll learn why checking election engagement metrics matters, which metrics to track for improving election participation, and mistakes to avoid when parsing through election analytics.
Why Do I Need Election Analytics?
Monitoring election analytics gives you powerful insights into what worked and what needs to improve. Without examining this data, you risk repeating the same mistakes in future elections, which could erode members’ trust in your leadership.
Fortunately, using a full election analytics suite helps increase member participation and streamline the overall election process. Check out our advanced Election Analytics to put this data to work for your organization.
Making the time to review election engagement data can help you:
- Boost member engagement: Monitoring participation rates over time reveals where engagement is strong and where you may need to increase outreach. This direct feedback helps improve turnout and member satisfaction.
- Spot (and fix) voting barriers: Metrics like ballot drop-off rates and rejection reasons (such as missing signatures, overvotes, or ineligible members) help you identify friction points in the voting process and improve instructions or accessibility before the next election.
- Optimize marketing and communication campaigns: By tracking email open rates, clicks, and bounce rates, you can refine message timing and content, ensuring your communications reach active members effectively.
- Make data-driven decisions: Leveraging analytics transforms gut-based decisions into a structured, metrics-backed strategy. Lean on the data to intelligently allocate your resources while giving members a better experience.
Real-World Examples Of Data-Driven Election Turnarounds
Election data is an unbiased and personalized source for constructive feedback. Take it from a co-op that used post-election surveys to understand the member experience. In partnership with the co-op, SBS sent a Voter Satisfaction survey to voters. Once the responses came in, SBS used a private AI model to analyze the comments.
After combing through member survey feedback, a report found:
- “Easy voting process” was mentioned 56 times. Members consistently appreciated the straightforward and user-friendly interface.
- Voting speed came up 10 times, with members praising how quick and efficient the experience was.
- Candidate biographies were referenced 8 times, with voters saying they relied on this information to make informed choices.
The positive responses helped the co-op understand which new processes and changes had the greatest impact on voters. Still, the organization didn’t just celebrate its wins; it also used data to spot areas for improvement.
For example, some voters were confused about bylaw changes and reported login issues due to unclear passcode instructions. The co-op would never have known about these issues if it hadn’t taken member feedback seriously. Armed with this information, the co-op can make changes to future elections, giving members an even better experience.
A different SBS client needed help sifting through nearly 2,300 voter comments from 29 elections. SBS analyzed these comments using an AI model to easily spot common themes and identify areas for improvement in the voting process and governance – and all in record time, thanks to intelligent automation.
While many voters applauded the digital voting format for its clarity and ease of use, the data also revealed opportunities to refine the experience:
- Concerns around ballot fairness, such as being required to vote for a set number of candidates or seeing “recommended” labels next to certain candidates, raised red flags for some participants.
- Technical support needs varied. Not all voters shared the same comfort level with digital voting, which pointed to the need for better guidance and support tools.
The average satisfaction rating across the 29 elections analyzed was 72.2%, below the SBS average of 90%. That’s no reason to despair, though: this score gives the association a helpful benchmark for improving future elections.
How Member Data Analytics Can Shape Your Next Election
Election participation data tells you what you’re doing right, as well as areas where you need to improve. Since members control the direction of your organization, it’s crucial to make the voting experience as simple as possible to encourage future participation.
Your voting platform will collect a significant amount of data. All of it can be useful, but monitoring these metrics will help you find quick wins.
1. Participation Rate
Participation is a core metric of engagement. Low turnout can signal that members feel disconnected, confused, or unmotivated. By breaking it down, you can target communications to underperforming groups and boost involvement where it’s needed most.
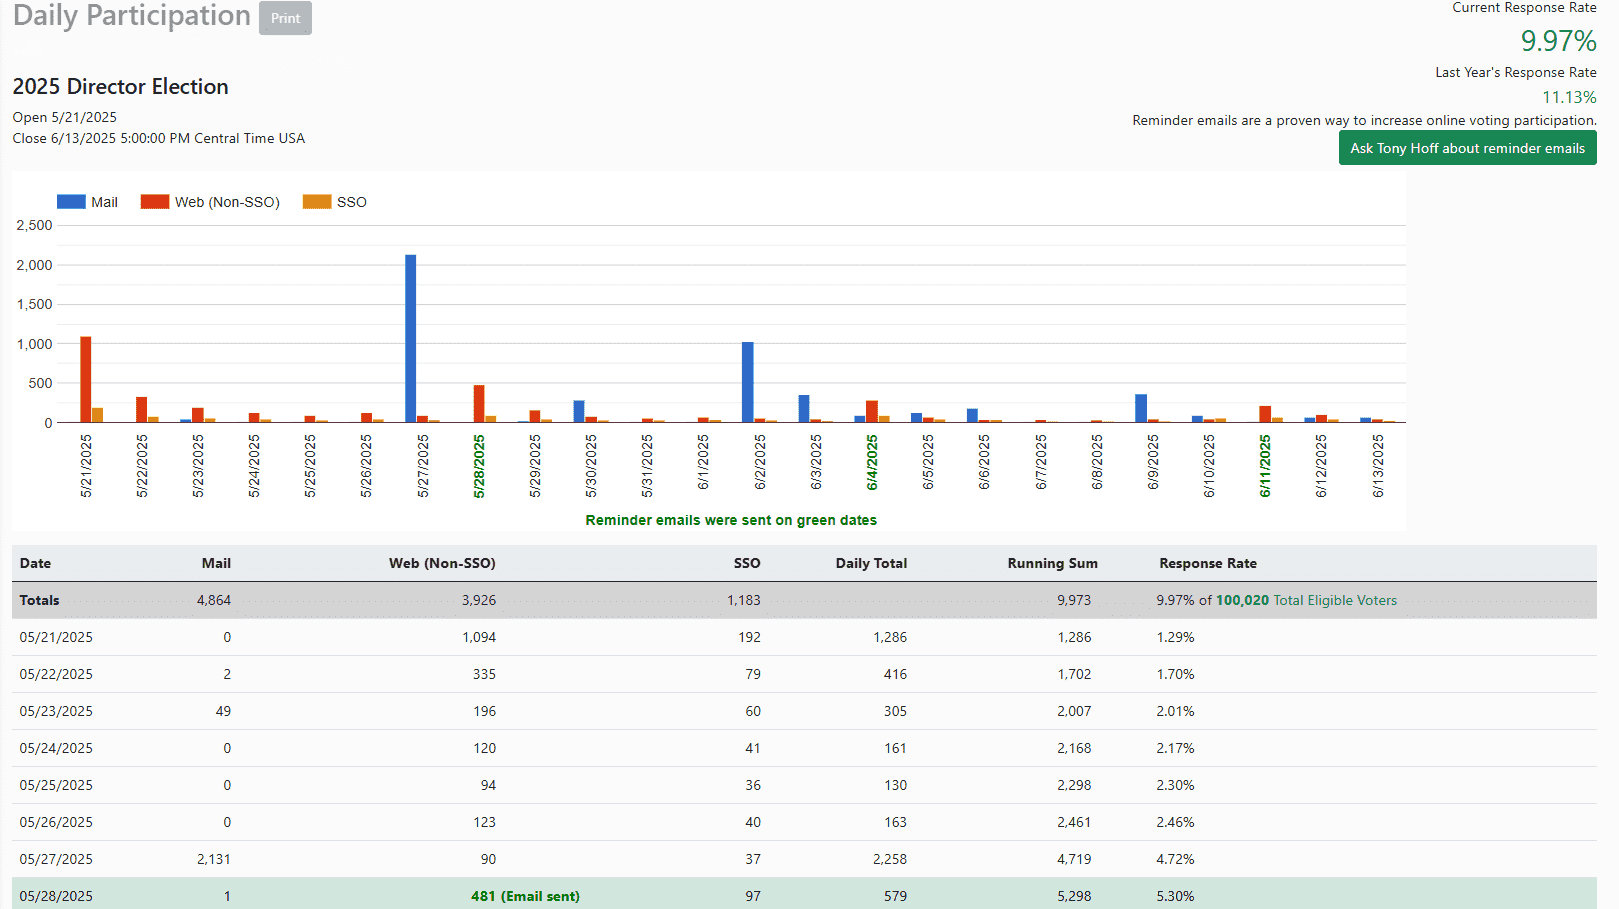
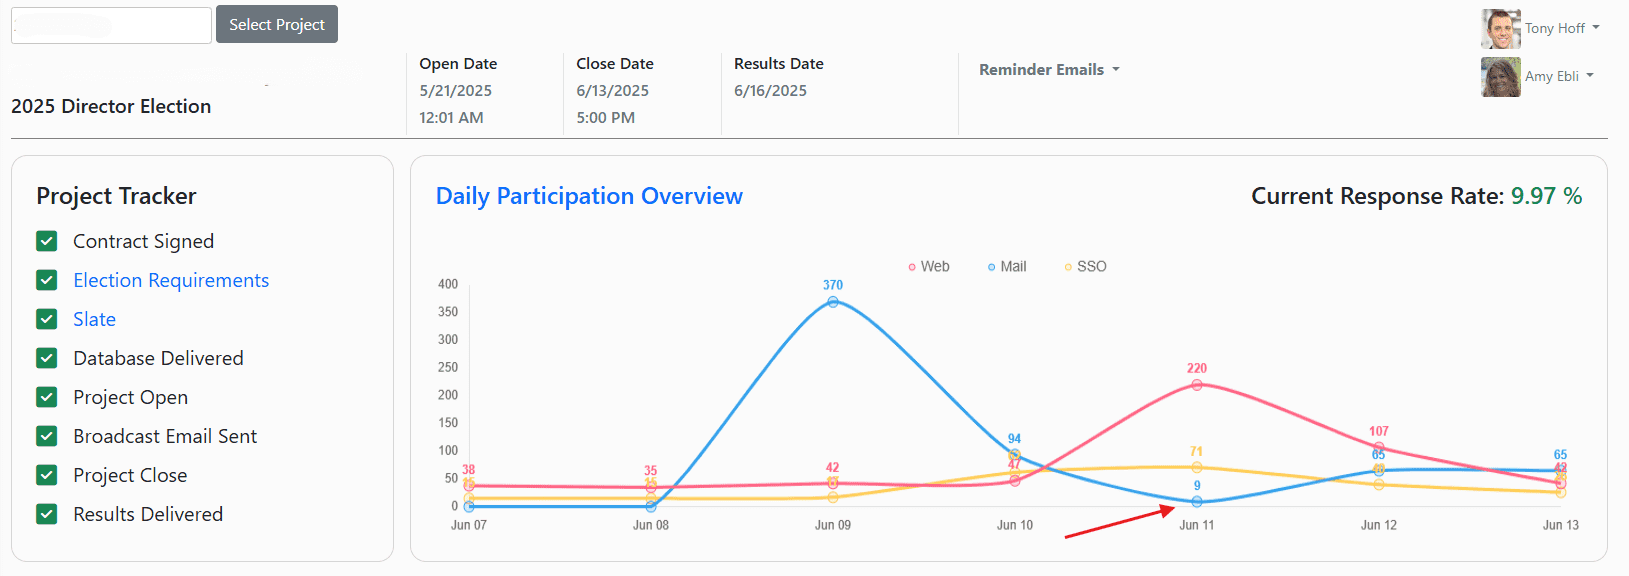
Measure engagement year-over-year (YOY), by district, or by election type (like director elections vs. bylaw votes). SBSHub’s Daily Participation Report makes it easy to monitor trends in real-time and compare them to prior years to better understand what’s working.
2. Ballot Drop Off Rate
If you’re running a paper or hybrid election, understanding when paper ballots are returned can inform your outreach strategy. Drop-off analysis helps you fine-tune mailing timelines and send better-timed reminders. If returns slow down year-over-year, you may need to adjust deadlines, improve instructions, or consider digital options. Use SBSHub to track ballot returns over time and see whether timing, mailing methods, or other variables influence member engagement.
3. Device
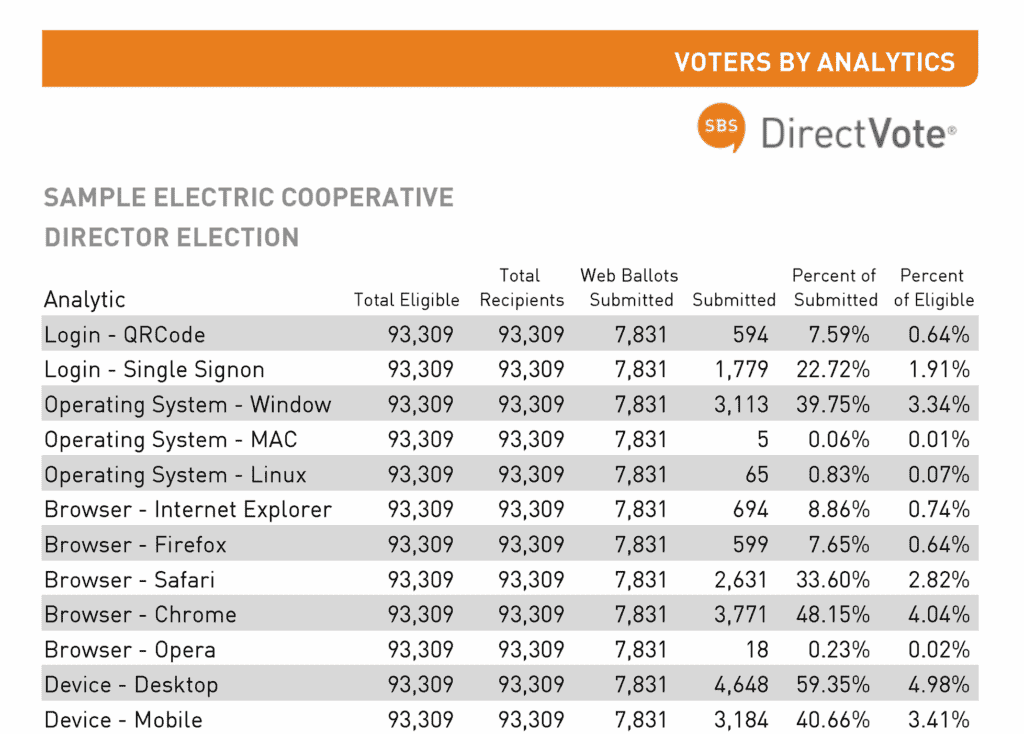
Are your members voting from their phones or their computers? Device data shows how your members engage with your platform. For example, if most users are voting via mobile, optimizing your ballot layout for smaller screens could increase satisfaction and reduce drop-off mid-process. The Voter Analytics Report helps you understand device preferences so you can optimize your voting interface and emails based on member preferences.
4. Email Performance
Email is one of your most powerful outreach tools, but it’s only effective if members read your messages. Understanding which messages resonated helps you write better copy, refine subject lines, and clean up outdated contact lists.
After each email broadcast, you can request an add-on report with open rates and click-through data to evaluate performance. We also provide bounce rate reporting at no cost, so you can clean up your contact list and ensure that critical reminders reach the right people.

5. Invalid or Rejected Ballots
Every invalid ballot is a missed opportunity. Identifying the reasons for invalid or rejected ballots gives you the opportunity to update instructions, offer voter support, or simplify the process, reducing confusion and increasing valid turnout next time.
Understanding why a ballot is rejected is essential for improving your election process, especially for paper or hybrid elections. In our add-on Invalid Ballot Report, you’ll see reasons like: missing signatures, no ballot, or no secrecy envelope.

By reviewing this data, you can identify what voter instructions need clarification or whether you need to adjust the ballot to reduce these errors.
Mistakes To Avoid When Looking at Election Data
Data is a powerful tool, but like any tool, you need to wield it correctly. Even with powerful platforms like SBSHub, interpreting election data properly requires care. Maximize your data insights by avoiding these common missteps.
Treating Every Metric As Equal
Not all data points are equally important. While all data has a role to play, it’s better to identify the key points that matter most to you. After all, exploring every possible snippet of data is both overwhelming and might even lead to some false positives.
Instead of overwhelming your team with data, create a hypothesis first. Formulate a question upfront (something like, “Did mobile users drop off more in 2025?”) and then test it based on your data. With this approach, you receive meaningful feedback without getting mired in complex data.
Over-Simplifying The Data
Numbers can mislead. For example, a spike in turnout in one district may not apply across your entire membership. Misapplication of statistics, like assuming correlation equals causation, can point you in the wrong direction. Always check whether a trend holds consistently over different groups. In some cases, using an AI analytics tool can help you make meaning from voter feedback.
Focusing on Turnout Versus Trends
A high turnout number might feel like a win, but it doesn’t always reveal how members felt about the process, what barriers they faced, or which outreach strategies worked best. If you only look at participation rates, you risk missing richer behavioral insights. Instead, track trends over time, such as shifts in device usage or the timing of ballot returns. These tell you not just how many people voted, but how they engaged and what’s influencing their behavior.
Assuming Non-Voters Are Disengaged
Just because someone didn’t vote doesn’t mean they don’t care. Some members may have missed reminders, felt unqualified to vote, or didn’t understand the ballot. Use post-election surveys or open-ended feedback to explore why certain members didn’t participate, and then address those specific barriers in your next election cycle.
Make Your Next Election Even Better
Running a successful election is a big milestone for any association. However, it’s important to invest in constant improvement to boost member engagement in the long term. Election analytics help you move from simply managing the process to actively improving it.
With the built-in reporting tools and optional voter feedback reports provided by SBS, you can spot participation patterns, eliminate confusion, and tailor your strategy to what your members actually want. From tracking turnout by district to understanding rejected ballots, every data point is a chance to deepen engagement, boost satisfaction, and build long-term trust with your members.
Put data to work for your association: Contact SBS today.

Tina joined the SBS team in early 2024 as a Marketing Specialist. Her passion for marketing, communications, product management, and customer service hails from a diverse background in health and wellness. As an award-winning product manager, Tina brings a wealth of experience to the team and a broad perspective to help our clients succeed in their elections.