What 79,000 Voters Reveal About the Online Voting Experience

Click image to view full size.
Last Updated on July 16, 2026 by Hannah Seeley
A ballot doesn’t just produce an outcome. It also produces a reaction. Voters come away from an election feeling confident, confused, reassured, frustrated, informed, or shut out. Those feelings matter because voter sentiment shapes how people view the credibility of the election process itself. Amid the growing prevalence of online voting, SBS aimed to understand how voters perceive and evaluate the electronic voting process.
To obtain these insights, an anonymous, single-item survey was administered immediately following ballot submission to assess voters’ perceptions of the electronic voting process. Our overall data set included 79,025 voter satisfaction survey responses gathered in 2024 and 2025. The primary takeaway is that voters conveyed a highly consistent message: online voting is effective and easy, while the broader election process (i.e. number of candidates or clearly listing candidate goals) still has opportunity for improvement.
Furthermore, when the voting process is simple, clear, and informative, voters express high confidence in both the technology and the organizations behind it. But when even small friction emerges, or there’s limited candidate participation, trust erodes quickly. These findings reveal not just what voters think about the digital voting experience, but what modern democratic participation now requires from member-based organizations.
The State of the Digital Voting Experience 2024-2025
Satisfaction with online voting remained consistently high in both years, but voter feedback reveals a growing focus on election quality, candidate choice, and meaningful participation, particularly concerns surrounding uncontested elections.
The Average Satisfaction Index remained exceptionally stable at 4.51 out of 5 in both 2024 and 2025. Positive ratings also held strong, with 87.8% of voters reporting a satisfied or very satisfied experience in 2024 and 88.1% in 2025. Despite slight fluctuations in response volume, the data indicates that voters continue to view the online voting experience favorably.
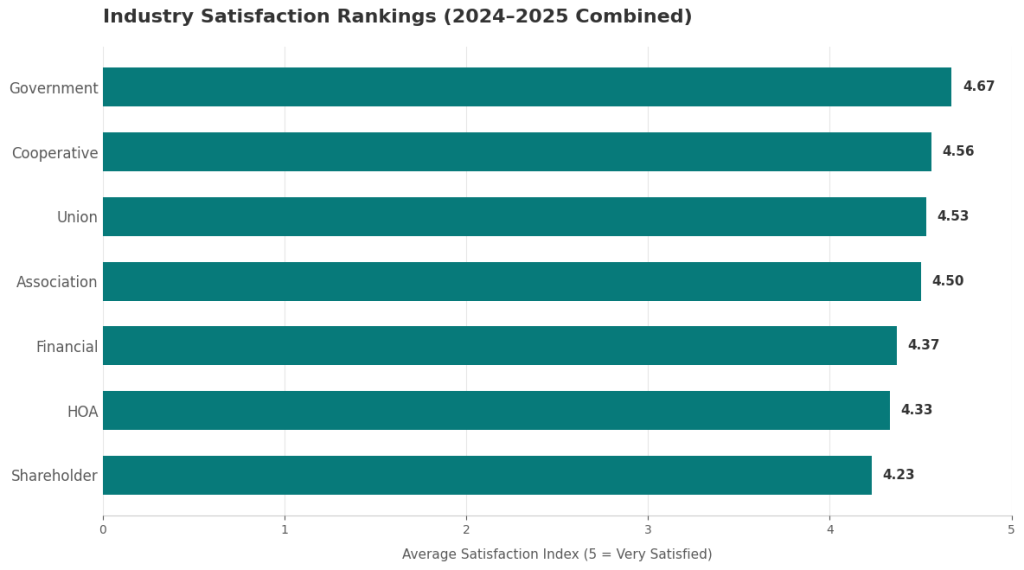
Industry Voter Satisfaction Rankings

At the same time, satisfaction levels remained remarkably stable across both years. The Average Satisfaction Index held steady at 4.51 out of 5 in both 2024 and 2025, while positive ratings increased slightly from 87.8% in 2024 to 88.1% in 2025. Neutral ratings declined from 6.6% to 6.3%, suggesting that voters remained consistently positive about their overall voting experience.
On the other end of the spectrum, dissatisfaction remained exceptionally low and virtually unchanged, accounting for 5.6% of responses in both years. This stability is notable given evolving voter expectations and the diverse range of organizations represented in the study.
We also noticed a change in the volume of comments between 2024 and 2025, with totals shifting from 42,828 comments in 2024 to 36,197 in 2025. This difference should not be interpreted as a decline in voter engagement or willingness to provide feedback, but rather as part of an overall decline in participation rates, influenced by year-to-year variation in voting cycles. What is meaningful, however, is that dissatisfaction remained low, and even declined slightly, despite fewer overall comments.
More importantly, the nature of voter feedback continues to evolve. While voters overwhelmingly praised the convenience and accessibility of online voting, many of the most critical comments focused on election structure rather than voting technology. Concerns about uncontested elections, limited candidate choice, nomination processes, and representation appeared frequently across industries, suggesting that organizations have largely solved many of the mechanics of online voting and are increasingly being judged on the quality and competitiveness of the elections themselves.
It’s important to address friction points, but we believe it’s equally helpful to understand what’s working well for member association elections, too. Across industries and voter types, highly satisfied voters consistently pointed to a handful of factors that made voting worth their time.
The Bright Spots in Voter Satisfaction
Regardless of organization or industry, the biggest driver of satisfaction was clear: ease of use. More than half (55.5%) of positive comments referenced the online voting experience as easy, simple, convenient, quick, or straightforward. Voters consistently praised the ability to access their ballot, review information, and complete the process in just a few minutes.
Beyond usability, voters also placed significant value on having information available while voting:
- 55.5% of positive comments highlighted the simplicity, convenience, or ease of the voting experience.
- 17.7% praised access to candidate information, including biographies, profiles, candidate statements, videos, and other materials that supported informed decision-making.
- 15.4% specifically mentioned candidate biographies or profiles as a valuable feature of the online ballot.
Our study also found patterns across certain industries.
Government organizations (including governmental employees and pension participants) consistently posted the highest satisfaction scores in the study, with an Average Satisfaction Index of 4.65 in 2024 and 4.70 in 2025. Voters in this segment frequently praised the voting experience for its simplicity, clear instructions, and convenient online access.
These bright spots point to a few common denominators of excellent voting experiences:
- The process has to be easy. Not “easy once you figure it out,” but genuinely intuitive from the start.
- Voters want information available while they’re voting.
- Access matters a lot. The easier it is to access the ballot through familiar channels like single sign-on, email or QR codes, the higher satisfaction tends to be.
- Excellent voting experiences reduce uncertainty. They make it easier for voters to understand what they’re doing, why they’re doing it, and how to do it without second-guessing themselves.
The Biggest Pain Points in the Voting Experience
Every election brings its own complexities, and even well-run elections can reveal opportunities for improvement. Understanding the issues that have the greatest impact on voter sentiment helps organizations strengthen trust, increase participation, and improve the overall election experience.
Perhaps the most important finding from this year’s study is that voter dissatisfaction is increasingly driven by the quality of the election itself rather than the technology used to conduct it. While voters consistently praised the convenience and accessibility of online voting, many of the strongest criticisms focused on election structure, candidate choice, and opportunities for meaningful participation.
The most significant pain points included:
Uncontested elections and limited candidate choice:
Voters frequently questioned the value of participating when only one candidate appeared on the ballot or when the number of candidates matched the number of available seats. Comments often described these elections as “rubber stamping” rather than meaningful member participation.
Candidate information gaps:
Voters wanted more detailed biographies, statements, videos, qualifications, and opportunities to compare candidates. Many members indicated that better information would help them feel more confident casting their ballot.
Ballot clarity and voting instructions:
Voters occasionally expressed confusion about proxy voting, ranking systems, eligibility rules, and election procedures. Clearer instructions can help reduce uncertainty and build confidence in the voting process.
Candidate bio navigation and scrolling:
A smaller group expressed challenges with scrolling through biographies, accessing candidate information, or navigating between biographies and the ballot.
Our data also shows that satisfaction drivers vary by industry:
- Associations: These voters responded positively to having candidate bios visible on the side of the screen, which made it easier to review information and vote in a single view. But those same voters also raised concerns about the legitimacy of uncontested elections, so convenience alone doesn’t solve trust issues.
- Cooperatives: Voters appreciated quick, easy access via email or QR codes in addition to mail-in voting. They also expressed confusion about proxies versus direct votes and uncertainty about whether they had meaningful choices.
- Financial: There was a recurring need here for more candidate information, especially for candidate statements or bios on the ballot.
Shareholder organizations and HOAs ranked among the lower-scoring segments in the study, with Average Satisfaction Indices of 4.25 and 4.33, respectively. Even within these groups, most voters viewed the voting process positively, while criticism tended to focus on election structure, candidate availability, and governance concerns rather than the voting platform itself.
However, these results should be interpreted with care. These sectors often feature high‑stakes, and emotionally charged elections, including capital investment decisions and governance changes in HOAs. Often voter comments frequently reflect broader frustrations with the issues at hand. In many cases, voters are using the survey to voice concerns about leadership decisions, community dynamics, or long‑standing governance tensions.
It’s also worth noting that this group represents the smallest dataset in the study. Because fewer elections and fewer voters are involved, a single contentious issue or highly engaged voter group can disproportionately influence average scores. When viewed in this context, lower satisfaction in Shareholder organizations, and HOAs is less an indictment of the voting experience and more a reflection of the unique political, financial, and interpersonal dynamics that tend to define these environments.
The data points to a broader set of recurring concerns across all types of organizations. In particular, these concerns include:
- Uncontested elections
- Confusion over proxy voting
- Unclear eligibility and districting requirements
- Insufficient time to vote
What ties these concerns together is that they all affect a voter’s sense of confidence. They make people ask basic but important questions: Am I eligible? Do I understand my choices? Did I get enough time? Is this process fair?
Those aren’t small questions. They shape how voters judge the integrity of your election.
One of the most important findings here is that these pain points often cluster together. In other words, one bad experience can make voters more likely to have other issues. A person who already feels frustrated by unclear ballot language is more likely to respond negatively to limited choices or confusing rules. That compounding effect lowers trust and can reduce future turnout.
How Organizations Can Improve the Voter Experience
Fortunately, voter frustration is fixable. Follow these research-informed best practices to reduce friction and strengthen voter confidence.
Clarify Eligibility Upfront
Many participants in our study were confused about whether they were eligible to run for office or to vote. This type of confusion hurts participation and satisfaction, so clarify these requirements long before voting begins – and share them with all members.
Organizations should proactively recruit and develop potential candidates throughout the year, rather than waiting for nominations to open. Providing clear expectations for leadership roles and encouraging them to submit thoughtful candidate statements about their experience, priorities, and vision helps voters make informed decisions and supports more competitive, meaningful elections.
For maximum engagement, create a brief infographic explaining who’s eligible to run or vote, as well as who isn’t eligible. You should also provide a contact email below the eligibility rules so members can reach out if they have any questions. Then distribute these materials widely across every communication channel to ensure they reach all members.
Simplify Ballot Access
Ease of access is critical. Our study found that one of the underlining pain points were ballot access issues where members often turned to SBS’ voter support to resolve. To fix this, simplify logins wherever possible. Adding options like email, text message invites, single sign-on (SSO), and QR code logins will reduce friction.
Voter comments reveal that even small refinements such as, cleaner ballot emails, QR code access, mobile‑friendly layouts, and clearer candidate information had a noticeable impact. More than half of positive comments (55.5%) highlighted ease of use, while 17.7% praised access to candidate information and 15.4% specifically referenced candidate biographies or profiles. These findings suggest that clear communications, informed decision-making tools, and a simple voting experience play an important role in overall voter satisfaction.
Put simply, you don’t need a dramatic overhaul to improve voter sentiment; small, common-sense fixes can have a big impact.
Prioritize Reliability
Even small technical interruptions can create outsized frustration during an election, which is why it’s important to ensure voters aren’t surprised by session time limits. SBS election sites include a customizable timeout warning for every election, giving voters advance notice before their session expires.
Voters can also save their progress, exit the site if needed, and return later during the voting period with their selections preserved. This allows voters to review candidate information at their own pace and complete their ballot without losing their selections, reducing stress and improving overall confidence in the voting experience.
Use Clear Language
Confusing language has no place on a ballot. Use plain language throughout the ballot, especially when explaining more complex structures like proxies. When in doubt, use a grade-level checker to keep your writing as close to a sixth-grade level as possible. Also, if the ballot includes A/B options on how to submit their vote, you should explain those choices directly within the ballot.
Give Voters Context On The Ballot
Our report found that voters want more information on candidates and issues within the ballot itself. Including candidate information is a major value-add: 17.5% of commenters wanted more bios and statements, plus links to candidates’ photos and videos.
Candidate bios, comparisons, photos, statements, and explanations of ballot measures all help voters feel more informed. Without them, the election can feel superficial or illegitimate. Voters may even question fairness if one candidate provides more information than another.
Make Voting Inclusive
Your voters have different preferences, and catering to their needs will make the election more inclusive. In most cases, that means offering a hybrid election where voters can get paper ballots by request.
On the digital side, it’s essential to use text that’s large enough for voters to see. That could affect the mobile experience, though, so you may need to train voters on how to adjust their font size at the browser level.
Over-Communicate
Communication issues can be a problem for any organization, but they can make or break voter satisfaction. For starters, you need to communicate with members long before the election. Voters want clearer notice about when voting opens, how long it will remain open, and how they’re supposed to access the ballot.
Clear voting instructions are also crucial to voter satisfaction. Voters should easily understand:
- What their choices mean
- How proxy voting works
- What actions they need to take
- Candidates goals and visions for the organization
Better instructions won’t solve every issue, but they can remove a surprising amount of avoidable frustration. And when voters understand the process, they’re much more likely to trust it.
Don’t just send messages via one channel, either. Your members have different preferences and engage with your organization on different channels. At a minimum, announcements should go out via:
- Email or text message
- Your website
- Social media
- Direct mail
- Newsletters
Communication during the voting process also matters. For example, adding a “Thank you for voting!” message after ballot submission reduces anxiety about whether a member’s vote went through. Survey & Ballot Systems also allows organizations to customize the text that appears throughout the voting website, including post‑voting messaging.
In addition, voters can be automatically redirected to any webpage the client chooses after logging out of the site. Many organizations use this feature to send voters to an “Election Information” page where they can learn how results will be shared, find annual meeting details, or explore how to run as a future candidate. This proactive guidance helps reduce confusion, lowers support requests, and strengthens voter confidence throughout the election process.
Provide Enough Time
Voting windows matter more than you might realize. If your windows are too short, willing voters could miss their chance to participate. Extend voting windows as long as your bylaws allow. That gives voters more time to sift through candidate information and make decisions.
Remember to over-communicate during the voting window, too. If you send just one email with a link to the ballot, plenty of voters will miss that first message. Survey & Ballot Systems can help you reach out to members who haven’t voted yet, which can boost turnout without annoying those who already voted.
Be Transparent About Results and Turnout
For many voters, one of the most frustrating parts of the process is what happens after the election: nothing.
Voters want to know that their participation mattered. One of the best ways to reinforce that is to communicate results after the election – and ideally, as soon as possible.
This can be as simple as an email sharing:
- Who won
- What the total turnout looked like
- Next steps for approved ballot measures
- How to become a candidate in the next election
Collect Feedback
Even if you’re happy with your election turnout, there’s always room for improvement. Remember, “good enough” isn’t good enough, especially when voters expect more from the voting experience.
First, meet with your internal election team to discuss what went well and what you want to improve for next time. After this post-mortem, send a brief election satisfaction survey to your members. This will give you a high-level understanding of what members appreciated and any areas of friction they encountered. Not all feedback will be helpful; the goal is to find common problems or themes.
Don’t just let members’ feedback fall flat. After taking time to review it, email everyone explaining:
- Average survey participation rates
- What members liked
- Trends for improvement
- Your concrete plan for change
You should thank the members for their feedback and explain the steps you’ll take to improve voting going forward. For example, if some members thought the ballot language was confusing, maybe you could set up a member committee next year to review ballot language before the election.
What Voter Satisfaction Means for Your Organization
Voter satisfaction might sound like a soft metric, but for leadership teams, it has very real consequences. When your members report negative experiences, they’re describing barriers that can weaken trust and legitimacy across three areas.
Risk Mitigation
Dissatisfied voters create more than bad survey results. They can also create reputational and governance risk. The clearest voter experience risk we identified is access friction. Although only 7.6% of detractor ratings mentioned login, passcode, link, or spam filtering issues, even small barriers can disrupt participation. These challenges are common across all secure online processes and often stem from factors such as outdated contact information or voters not recognizing the sender of the ballot email.
Another important risk is candidate scarcity. Across industries, many voters expressed frustration with uncontested elections, limited candidate choice, and uncertainty about how candidates are recruited or nominated. Organizations can reduce this risk by actively cultivating a pipeline of future leaders, clearly communicating nomination opportunities, and encouraging qualified members to run for office. Competitive elections not only increase engagement, but also strengthen confidence in the legitimacy and transparency of election outcomes.
Ultimately, the most effective risk mitigation strategy combines strong voter communication, accurate member data, accessible voting tools, and a healthy pipeline of qualified candidates. Together, these elements create elections that are not only easy to participate in, but also trusted, transparent, and meaningful.
How to increase voter participation
Before the election:
- Clean and update member data regularly
- Remove inactive emails, verify contact info, and ensure records are accurate.
- Announce the upcoming election early
- Tell voters when messages will arrive and who the sender will be.
- Provide whitelisting instructions
- Encourage voters to add the sending email address to their safe-sender list.
- Prompt voters to update their contact information
- Remind members to notify your organization if they’ve changed their email or phone number
During the election:
- Send reminders through multiple channels
- Email, text, and direct mail increase your reach.
- Ensure support availability is clearly visible
- SBS’ live voter support helps members cast their vote.
After the election:
- Review bounce rates and delivery diagnostics
- Identify patterns and improve data quality for future elections.
Democratic Legitimacy
Satisfied voters believe elections are fair and meaningful, but dissatisfied voters tend to think elections are just for show. That trend is clear in our findings. For example, association voters were concerned about the legitimacy of uncontested elections, and cooperative members were concerned about maintaining anonymous votes and proxy voting.
You can’t effectively lead an organization if members don’t believe your voting processes are legitimate. Not only does that put you at risk of contested elections and audits, but it also can reduce membership and increase your risk of lawsuits.
Listen To The Voice of Your Voters
Voter satisfaction isn’t a vanity metric. It’s one of the clearest signals of how sustainable your organization really is.
Across 79,032 voter satisfaction survey responses from 2024 to 2025, the message was clear: voters are more satisfied when the ballot is supported by the right information at the right time. They respond negatively when friction, confusion, or questions of legitimacy come up.
Don’t let these common pain points get in the way. The same trends that point to dissatisfaction can also tell you what to fix. More candidate information, clearer instructions, better ballot access, transparent follow-ups, and thoughtful communication can all improve the voter experience in meaningful ways.
It’s possible to streamline elections on your own, but for time- and resource-strapped organizations, that isn’t always realistic. Survey & Ballot Systems helps associations, cooperatives, financial institutions, and more design frictionless, data-backed elections that empower voters. See how our fully-managed voting services give your members the experience they deserve.

Since joining SBS in 2011, Tony has led company communications, branding, and product launches, maintaining SBS as the go-to for governance solutions. He regularly hosts educational webinars and speaks at national trade association events across the United States. Tony’s expertise has earned him media recognition, with features in outlets like Rural Electric Magazine, The Association Adviser podcast, Associations Now, and NBC’s King 5 Mornings in Seattle.